
Upgrade: This feature is available for free with Trackonomics Essentials. To access it, along with a suite of additional tools to grow your program, activate Trackonomics Essentials today.
This report helps you analyze how your stories or posts perform across key metrics. Use it to understand which content pieces drive engagement and revenue over specified time periods.
Access the report
From the top navigation menu, select Trackonomics.
From the drop-down menu, select Performance by Story.
Important: To make full use of this report, you must have impact.com's Publisher Tag installed on your website.
The data in this report is organized into the following sections:
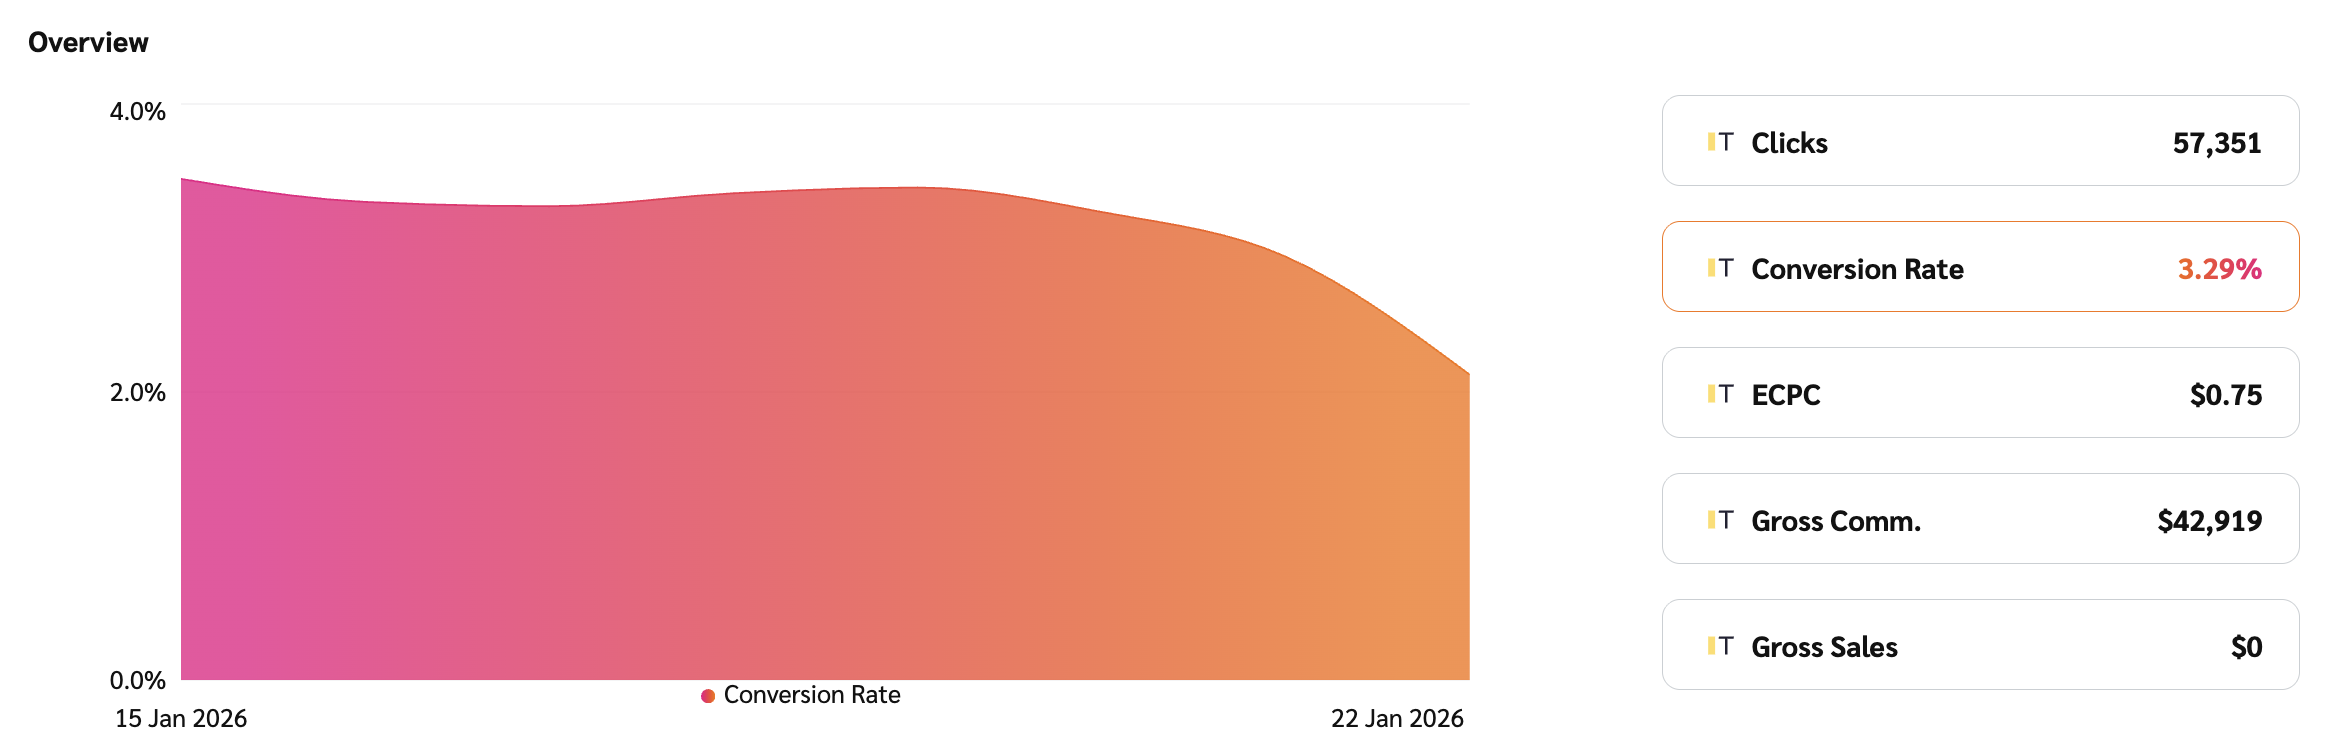
This section features a graph and an interactive metric display.
Primary trend graph: This area chart displays the trend of a single metric over your selected date range. The metric shown is controlled by the metric selector buttons located to the right of the graph.
Metric selector buttons: These buttons (e.g., Gross Commission, Clicks, Gross Sales) allow you to quickly change the data displayed in the primary trend graph, providing an immediate overview of that metric's performance.
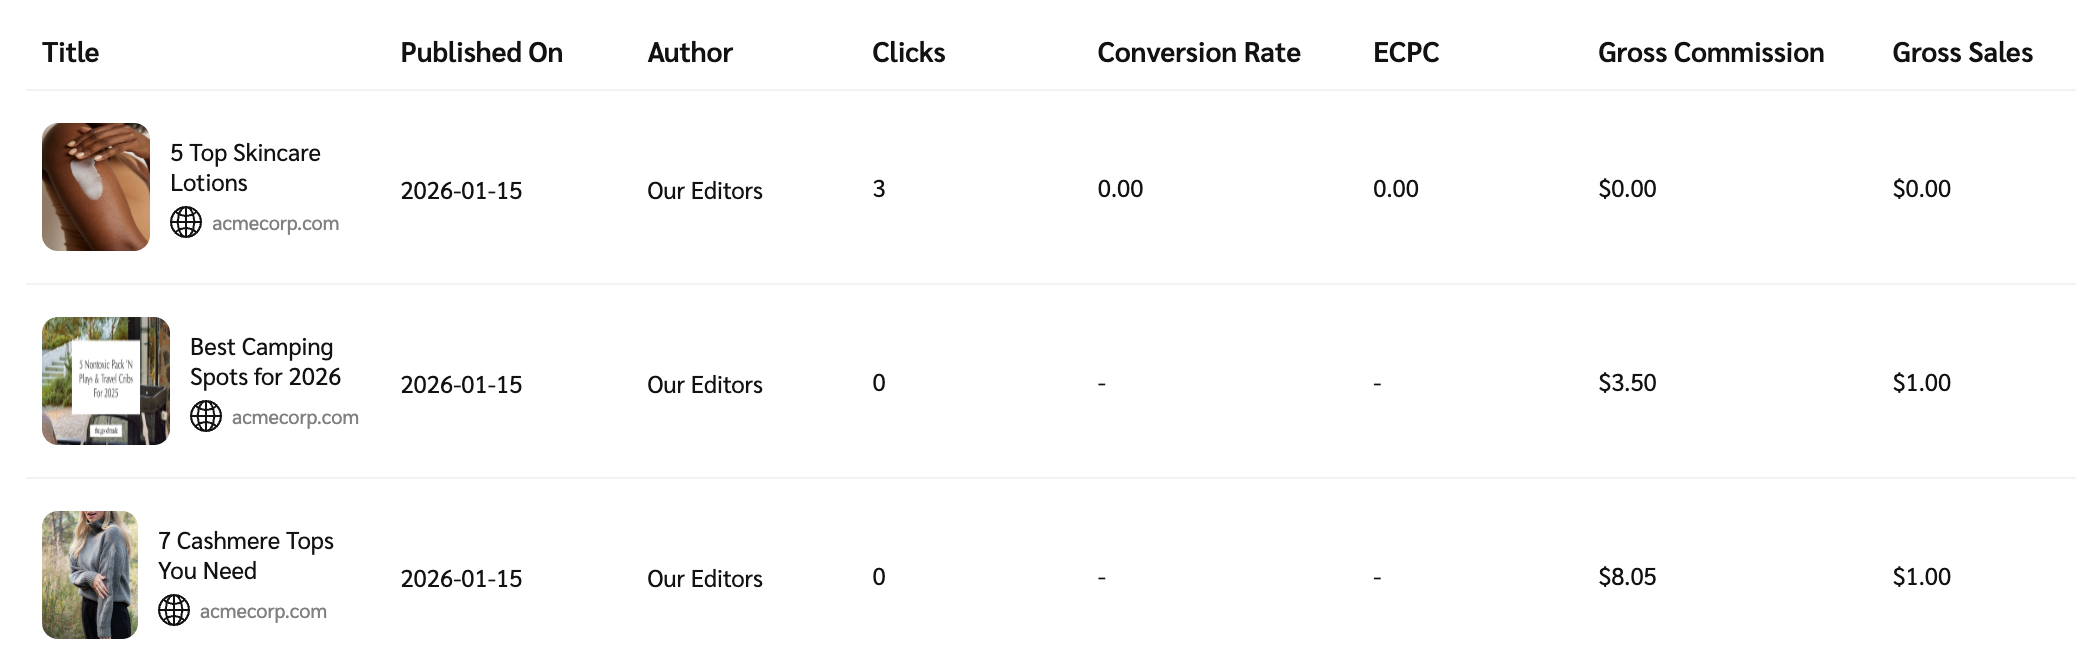
This set of data is presented in a table that covers data related to a specific post where a user performed the tracked action. Refer to the Data point reference table for more information on these data points.
Data point | Description |
|---|---|
Title | The title of the story or post where the tracked action (e.g., click or conversion) occurred. |
Published On | The date the story or post was originally published. |
Author | The author associated with the story or post. |
Clicks | The number of times impact.com tracked users clicking your affiliate links. This includes both unique and repeat clicks and helps measure traffic and engagement. |
Conversion Rate (CR) | The percentage of clicks that led to a successful, valid conversion (sale or lead). This metric helps gauge how well your traffic converts into actions. |
Effective Cost Per Click (eCPC) | The average commission earned per click, calculated by dividing your total commission earnings by the total clicks you generate. |
Gross Commission | The total commission for all valid actions (approved conversions only), before any deductions like adjustments. This amount reflects what you would earn if no reversals or clawbacks occurred. |
Gross Sales | The total value of validated sales (e.g., product purchases) that were not canceled or refunded. This metric reflects revenue driven by the story. |