
The Product Boost: Overview by Vendor report gives you a detailed view of how your vendor-funded Product Boost campaigns are performing. It helps you track which vendors are participating, how much budget has been consumed, and the revenue generated from boosted product sales.
From the left navigation bar, select
![[Engage] v2](https://paligoapp-cdn-eu1.s3.eu-west-1.amazonaws.com/impact/attachments/f01cdffa431a4d75ff09c130b66974d4-aa671735ec2b65af79961eaf59ab60af.svg) [Engage] → Reports → Retail Media.
[Engage] → Reports → Retail Media.Select by Vendor.
Below the report heading, filter for the data you want to view.
Use the options in the upper-right of the page to
![[Schedule report] vNext](https://paligoapp-cdn-eu1.s3.eu-west-1.amazonaws.com/impact/attachments/f01cdffa431a4d75ff09c130b66974d4-518305996b9b70e56da26aee92cbe615.svg) [Share] the report,
[Share] the report, ![[Download] v2](https://paligoapp-cdn-eu1.s3.eu-west-1.amazonaws.com/impact/attachments/f01cdffa431a4d75ff09c130b66974d4-a91344751be25d438e5bf166953fceb4.svg) [Download] it in PDF or CSV format, or update the displayed currency.
[Download] it in PDF or CSV format, or update the displayed currency.See the references below to better understand the report.
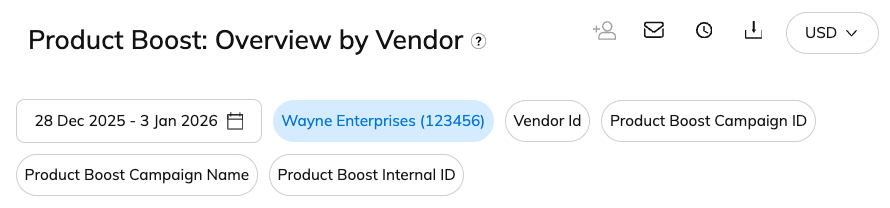
Filter | Description |
|---|---|
Date Range | Filter data by when it was created. |
Program | Filter for data linked to specific programs in your account. |
Vendor Id | Filter by the unique identifier of the vendor for which you want to view data. |
Product Boost Campaign ID | Filter by the unique product boost campaign identifier. |
Product Boost Campaign Name | Filter by the unique product boost campaign name. |
Product Boost Internal ID | Filter by your own unique identifier for this product boost campaign. |
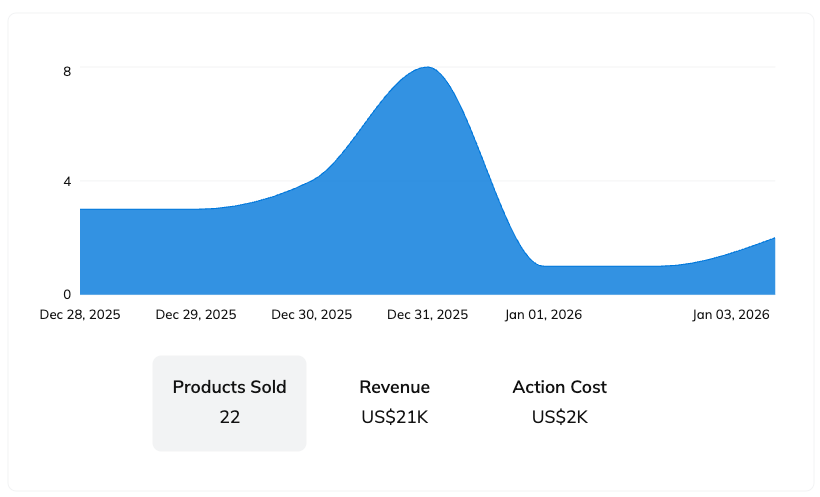
The snapshot widget lets you switch between metrics to track boosted product sales, partner payout costs, or revenue generated over time.
Hover your cursor over any point on the graph to see the exact metric value at that moment.
When you hover over the graph, you'll see an option to
[Download] the graph data in PDF or CSV format. The download file reflects the currently selected metric, i.e., Products Sold, Revenue, or Action Cost.
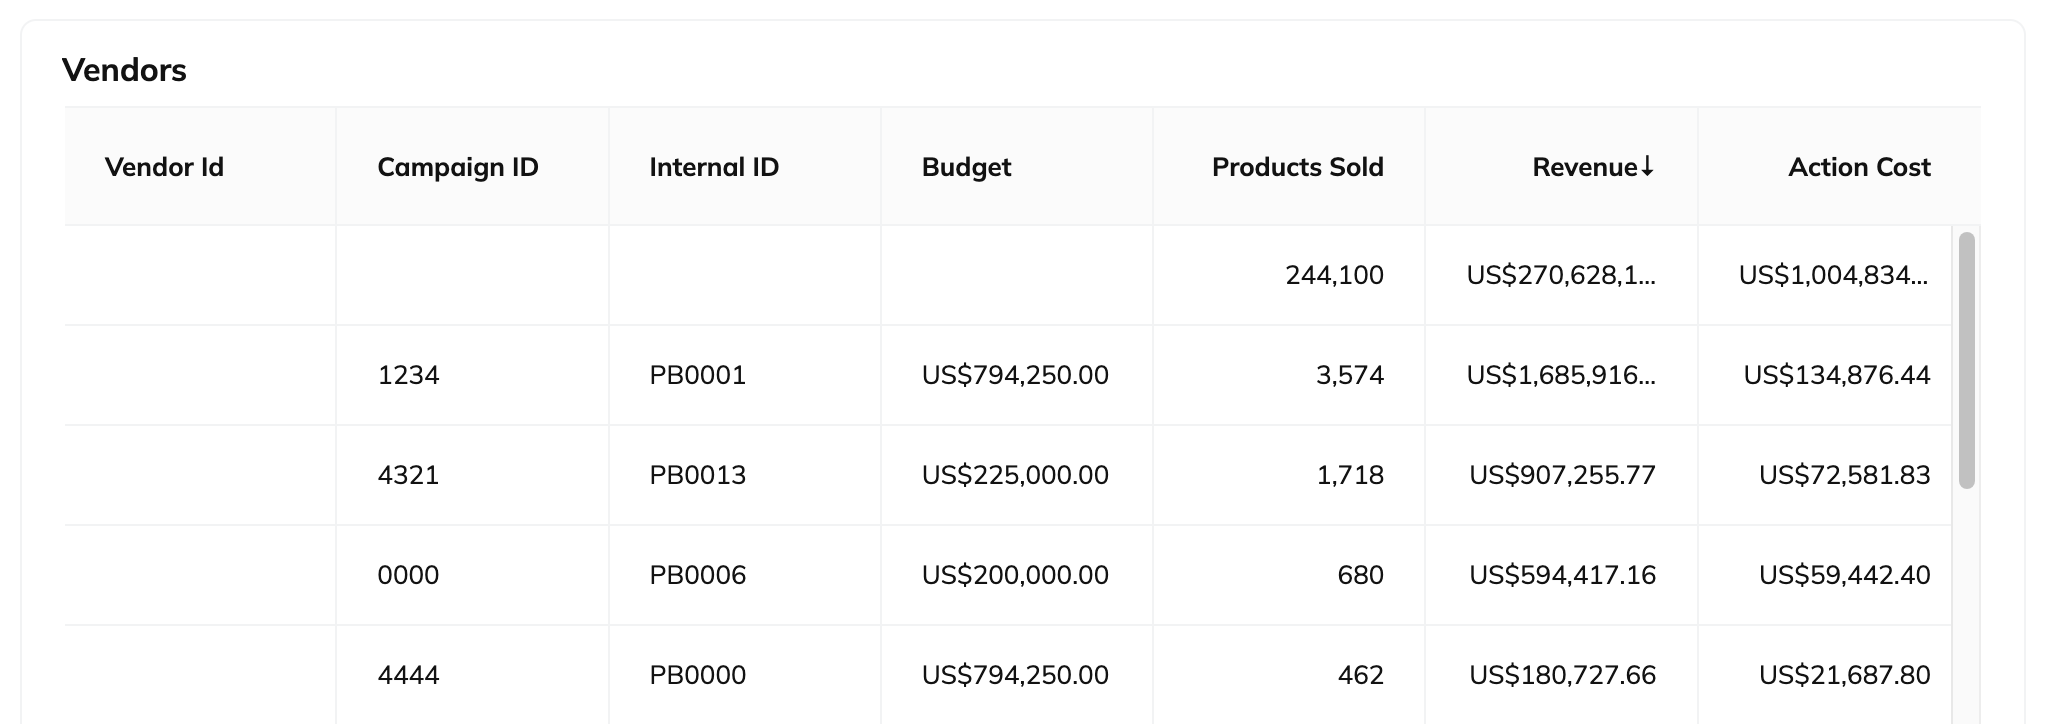
Hover your cursor over the table to
[Download] the table data in CSV or PDF format.You can also choose to get an
![[Export report] vNext](https://paligoapp-cdn-eu1.s3.eu-west-1.amazonaws.com/impact/attachments/f01cdffa431a4d75ff09c130b66974d4-fd77f03a4c5618018e59013607ed56bc.svg) [API] link, which lets you export the table data in NDJSON or CSV format.
[API] link, which lets you export the table data in NDJSON or CSV format.
Column | Description |
|---|---|
Vendor Id | The unique identifiers of the vendors associated with the Product Boost campaigns in your selected programs. |
Campaign ID | impact.com's unique identifier for the associated Product Boost campaign. |
Internal ID | The unique identifier you added to each campaign to distinguish your campaigns in reporting. |
Budget | The vendor-funded budget allocated to each Product Boost campaign. |
Products Sold | The total number of boosted products sold through promotions by your partners within your Product Boost campaigns. |
Revenue | The total revenue value you generated for vendors through product sales. |
Action Cost | The cost owed to your partners for driving boosted product sales. |