
The Performance by Month report shows you a wide range of tracking data broken down by month. KPIs, like actions, clicks, and more, can all be found here.
From the top navigation bar, select Reports → More Reports.
From the Category filter next to the search bar, select Performance.
Select Performance by Month.
You can also pin the report to the top navigation bar by hovering over the row and selecting Pin.
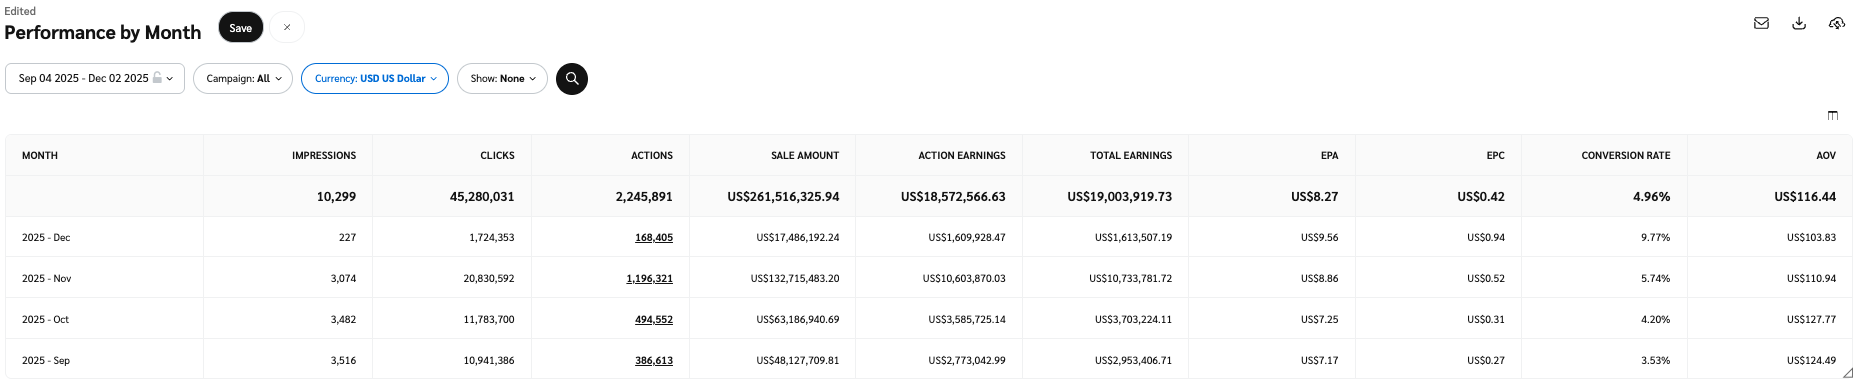
Below the report title, filter for the data you want to view. Select
![[Search] vNext](https://paligoapp-cdn-eu1.s3.eu-west-1.amazonaws.com/impact/attachments/f01cdffa431a4d75ff09c130b66974d4-378d7abd37e544e2e1a120594a46cf7a.svg) [Search] when you have your filters in place.
[Search] when you have your filters in place.View the Filter reference table below for more information.
View Report data column reference for your data, broken down by month.
View the Filter reference table below for more information.
You can use the icons at the top-right of the page to
![[Email] \ [Schedule]](https://paligoapp-cdn-eu1.s3.eu-west-1.amazonaws.com/impact/attachments/f01cdffa431a4d75ff09c130b66974d4-26ab390da8d9ada8ac7a438cf0dab45a.svg) [Schedule],
[Schedule], ![[Download]](https://paligoapp-cdn-eu1.s3.eu-west-1.amazonaws.com/impact/attachments/f01cdffa431a4d75ff09c130b66974d4-3c4e4755396515995392920856bbe536.svg) [Download] (in PDF, Excel, or CSV format), or
[Download] (in PDF, Excel, or CSV format), or ![[Export]](https://paligoapp-cdn-eu1.s3.eu-west-1.amazonaws.com/impact/attachments/f01cdffa431a4d75ff09c130b66974d4-cb2a7e3fae274c1926f8b6d9c8835591.svg) [Export] the report via API.
[Export] the report via API.
Column | Description |
|---|---|
Month | View the month and year that make up data for the row. |
Impressions | The number of audience members that viewed your content during a particular month. |
Clicks | The total number of link clicks that took your audience to your partnered brand's landing page during a particular month. |
Actions | The total number of conversions (sales, app installs, etc.) tracked for a particular month. This number excludes any reversed conversions. |
Sale Amount | This is the total amount of sales you have generated for your partnered brand. |
Action Earnings | The amount of compensation you receive for driving the traffic that resulted in conversions for the month. |
Click Cost | The aggregated value of the amount due to you for driving clicks. |
Total Earnings | See total compensation earned for your selected ad(s) during the chosen months. This is the total compensation you received from the brand for that ad. (e.g., Action Earnings + Click Cost earnings + performance bonus). |
EPA | This metric shows you your earnings per conversion (sales, app installs, etc.) per month during the chosen date range. |
EPC | See your total earnings per link click (EPC) for your selected program(s) during the chosen months. |
Conversion Rate | This is calculated as the number of Actions divided by the number of Clicks and represents the percentage of clicks that result in actions. |
AOV | The average order value (AOV) associated with a program. AOV=Sale Amount divided by Actions. |