
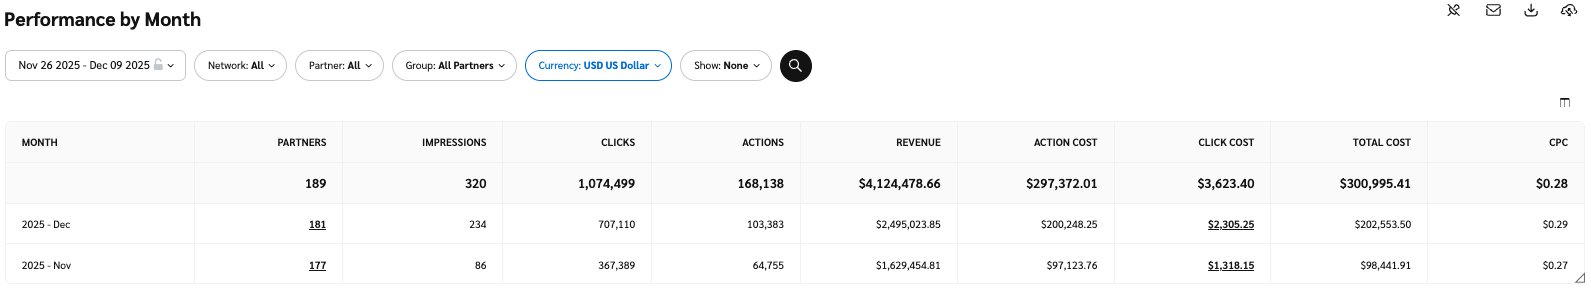
The Performance by Month report shows you a wide range of tracking data broken down by month. KPIs, like actions, clicks, and more, can all be found here.
From the left navigation bar, select
![[Engage] v2](https://paligoapp-cdn-eu1.s3.eu-west-1.amazonaws.com/impact/attachments/f01cdffa431a4d75ff09c130b66974d4-aa671735ec2b65af79961eaf59ab60af.svg) [Engage] → Reports → More Reports.
[Engage] → Reports → More Reports.Under More Reports, select Performance as the filter next to the search bar.
Select Performance by Month.
Below Performance by Month, you can filter for the data you want to view. Select
![[Search] vNext](https://paligoapp-cdn-eu1.s3.eu-west-1.amazonaws.com/impact/attachments/f01cdffa431a4d75ff09c130b66974d4-378d7abd37e544e2e1a120594a46cf7a.svg) [Search] when you have the filters in place that you want.
[Search] when you have the filters in place that you want.View the Filter reference table below for more information.
You can use the icons at the top-right of the page to
![[Pin]](https://paligoapp-cdn-eu1.s3.eu-west-1.amazonaws.com/impact/attachments/f01cdffa431a4d75ff09c130b66974d4-b10ec43201bcaf30c30bc5fce556104b.svg) pin,
pin, ![[Email] \ [Schedule]](https://paligoapp-cdn-eu1.s3.eu-west-1.amazonaws.com/impact/attachments/f01cdffa431a4d75ff09c130b66974d4-26ab390da8d9ada8ac7a438cf0dab45a.svg) schedule,
schedule, ![[Download]](https://paligoapp-cdn-eu1.s3.eu-west-1.amazonaws.com/impact/attachments/f01cdffa431a4d75ff09c130b66974d4-3c4e4755396515995392920856bbe536.svg) download (in PDF, Excel, or CSV format), or export the report
download (in PDF, Excel, or CSV format), or export the report ![[Export]](https://paligoapp-cdn-eu1.s3.eu-west-1.amazonaws.com/impact/attachments/f01cdffa431a4d75ff09c130b66974d4-cb2a7e3fae274c1926f8b6d9c8835591.svg) (via API).
(via API).
You can view the report data as a trend graph or table and compare certain metrics.
Below the trend graph is the data table. The data table provides different data points displayed in a column view. This view provides a detailed set of comparable numbers over the selected date range.
Refer to the Report data column reference below for more information on the columns found in the data table.
Add or remove columns from the report table using the
![[Column]](https://paligoapp-cdn-eu1.s3.eu-west-1.amazonaws.com/impact/attachments/f01cdffa431a4d75ff09c130b66974d4-63cbd5b88168715b031f0dd433962072.svg) [Columns] icon at the top-right of the report.
[Columns] icon at the top-right of the report.
Filter | Description | ||||||||||||||||||||||||||||||||||||||||||||||||||||||||||||||||||||||||||||||||||||||||||||||||||||||
Date Range | You can pull a maximum of 366 days of data. | ||||||||||||||||||||||||||||||||||||||||||||||||||||||||||||||||||||||||||||||||||||||||||||||||||||||
Network | Filter by data source. | ||||||||||||||||||||||||||||||||||||||||||||||||||||||||||||||||||||||||||||||||||||||||||||||||||||||
Partner | Select which partners for which you want to view data. | ||||||||||||||||||||||||||||||||||||||||||||||||||||||||||||||||||||||||||||||||||||||||||||||||||||||
Group | Filter data by partner groups. | ||||||||||||||||||||||||||||||||||||||||||||||||||||||||||||||||||||||||||||||||||||||||||||||||||||||
Currency | Set the currency in which you want to view report data. impact.com will convert the amounts to your selected currency. | ||||||||||||||||||||||||||||||||||||||||||||||||||||||||||||||||||||||||||||||||||||||||||||||||||||||
Show: Add data from a large selection of choices. These data points will get added to the table report under the graph after you select
| |||||||||||||||||||||||||||||||||||||||||||||||||||||||||||||||||||||||||||||||||||||||||||||||||||||||
Column | Description |
Month | A specific month. All data for a particular row was generated this month. |
Partners | The total number of partners for this date range. |
Impressions | The number of audience members that viewed content. |
Clicks | The total number of link clicks that took the partners' audience to your landing page. |
Actions | The total number of conversions (sales, app installs, etc.) tracked for a particular month. This number excludes any reversed conversions. |
Revenue | The total revenue of all driven actions for this month within the selected month. |
Action Cost | The amount of compensation paid to partners associated with a specific contract for driving the traffic that resulted in conversions. |
Click Cost | The aggregated value of the amount due to partners for driving clicks. |
Other Cost | Additional costs associated with performance bonuses, make-good payments, and placement fees. |
Total Cost | The total amount paid out over the selected month, i.e., the sum of your Action Cost, Click Cost, and Other Cost. |
CPC | The Cost Per Click. The total cost divided by the total number of clicks. |