This report allows you to see a summary of the performance of all your partners across all programs. You can use the Program filter to limit the results to programs of interest to you.
From the left navigation bar, select
![[Engage] v2](https://paligoapp-cdn-eu1.s3.eu-west-1.amazonaws.com/impact/attachments/f01cdffa431a4d75ff09c130b66974d4-aa671735ec2b65af79961eaf59ab60af.svg) [Engage] → Reports → More Reports.
[Engage] → Reports → More Reports.Under More Reports, select Beta as the filter next to the search bar.
Scroll through the list, find and select the Performance by Partner - All Programs report.
Alternatively, type in the report name in the search bar and press enter. Be sure to search the report in the same language your UI is set to.
Below Performance by Partner - All Programs, you can filter for the data you want to view. Select
![[Search] vNext](https://paligoapp-cdn-eu1.s3.eu-west-1.amazonaws.com/impact/attachments/f01cdffa431a4d75ff09c130b66974d4-378d7abd37e544e2e1a120594a46cf7a.svg) [Search] when you have the filters in place that you want.
[Search] when you have the filters in place that you want.View the Filter reference table below for more information.
You can use the icons at the top-right of the page to
 pin,
pin,  schedule,
  download (in PDF, Excel, or CSV format), or export the report
  (via API).
Filter
Description
Date Range
Filter data by when it was created. You can also compare two periods of time against each other.
You can pull a maximum of 366 days of data. However, you can still perform Year-over-Year reporting by selecting
![[Unchecked box]](https://paligoapp-cdn-eu1.s3.eu-west-1.amazonaws.com/impact/attachments/f01cdffa431a4d75ff09c130b66974d4-396370c2cdec89ba7d714c4c58e6845b.svg) [Unchecked box] compare to {Previous year}.
[Unchecked box] compare to {Previous year}.If you want to pull more than 366 days of data, you will need to create multiple reports.
Program
Filter data by program type. You can select which programs to include or exclude from the report using this filter.
Network
Filter by data source.
Partner Id
The unique identifier of the partner to which the performance data belongs.
Group
Filter data by partner groups.
Currency
Set the currency in which you want to view report data. impact.com will convert the amounts to your selected currency.
Show: Add data from a large selection of choices. These data points will get added to the table report under the graph after you select
[Search].Data point
Description
Payable Clicks
The number of unique clicks tracked, including clicks processed via CPCv2.
Actions - Event Type
The number of conversions generated for this event type.
Action Cost - Event Type
The total cost associated with driving the conversions for this event type.
Gross Actions
The total number of actions (including Reversed Actions).
Gross Actions - Event Type
The total number of actions (including Reversed Actions) by event type.
Gross Action Cost
The total cost of Locked and Open-Ended Actions plus Reversed Action Cost.
Gross Action Costs - Event Type
The total cost of Locked and Open-Ended Actions plus Reversed Action Cost by event type.
Partner Value 1 - 3
This is a custom tracking value that you can set for partners.
Company URL
The URL of the partner, if one exists.
Media Type
The type of partner, if identified.
Partner ID
A unique partner identifier, assigned by impact.com.
Network
A third-party network that won actions during the period specified for this report.
Cost per Action (CPA)
Total Cost of Actions divided by number of actions.
Cost per Action (CPA) - Event Type
Total Cost of Actions divided by number of actions by event type.
Imported Cost
The Cost of Actions imported from third-party tracking systems.
Click Through Rate
The number of Clicks divided by the total number of Impressions.
Join Date
Filter data by when the partner joined the program.
Conversion Rate
The number of actions divided by the total number of clicks across your program.
Conversion Rate - Event Type
The number of actions divided by the total number of clicks for this event type.
Return on Ad Spend (ROAS)
This number represents Revenue divided by Total Cost.
Return on Ad Spend (ROAS) - Event Type
This number represents Revenue divided by Total Cost by event type.
Return on Investment (ROI)
This number represents Revenue divided by Total Business Cost.
Return on Investment (ROI) - Event Type
This number represents Revenue divided by Total Business Cost by event type.
Average Order Value (AOV)
The total revenue of sale actions divided by the number of sale actions.
Average Order Value (AOV) - Event Type
The total revenue of sale actions divided by the number of sale actions by event type.
Margin
This number represents Revenue minus Goods Cost.
Margin - Event Type
This number represents Revenue minus Goods Cost by event type.
Total Business Cost
The total Cost of Goods plus Total Cost.
Total Business Cost - Event Type
The total Cost of Goods plus Total Cost by event type.
Discount
The discounted amount captured at conversion.
Client Cost
Client Cost charged by an Agency plus Total Cost.
Discount Rate
The percentage discount calculated as Discount divided by Revenue.
Discount Rate - Event Type
The percentage discount calculated as Discount divided by Revenue by event type.
Item Count
The number of products in the basket captured at conversion.
Goods Cost
The total cost of products in the basket captured at conversion.
Goods Cost - Event Type
The total cost of products in the basket captured at conversion by event type.
Revenue - Event Type
The total revenue per by event type.
Reversed Revenue
The total revenue of Reversed Actions.
Reversed Revenue - Event Type
The total revenue of Reversed Actions by event type.
Reversed Actions
The number of conversions that have been reversed across your program.
Reversed Actions - Event Type
The number of conversions that have been reversed by event type.
Reversed Action Cost
The total Action Cost of Reversed Actions.
Reversed Action Cost - Event Type
The total Action Cost of Reversed Actions by event type.
Reversal Rate
The number of reversals divided by the number of Total Actions.
Reversal Rate - Event Type
The number of reversals divided by the number of Total Actions by event type.
Raw Impressions
The total number of times the ad was displayed on a user's screen.
Raw Clicks
The total number of clicks tracked.
Open-Ended Actions
The total number of pending actions.
Open-Ended Actions - Event Type
The total number of pending actions by event type.
Confirmed Actions
The total number of approved actions.
Confirmed Actions - Event Type
The total number of approved actions by event type.
Gross Revenue
The total processing and locked Revenue plus Reversed Revenue.
Gross Revenue - Event Type
The total processing and locked Revenue plus Reversed Revenue by event type.
Answered Calls
The number of tracked phone calls with a
CallStatusofANSWERED.Country
See the specific country.
State
See the specific state.
You can view the report data as a trend graph or table and compare certain metrics.
The trend graph enables you to filter your report according to the core group of metrics that drive the highest value. This view provides the selected metric’s daily trends over a specific date range.
Alternate between the line, bar, and treemap views by selecting the view icon.
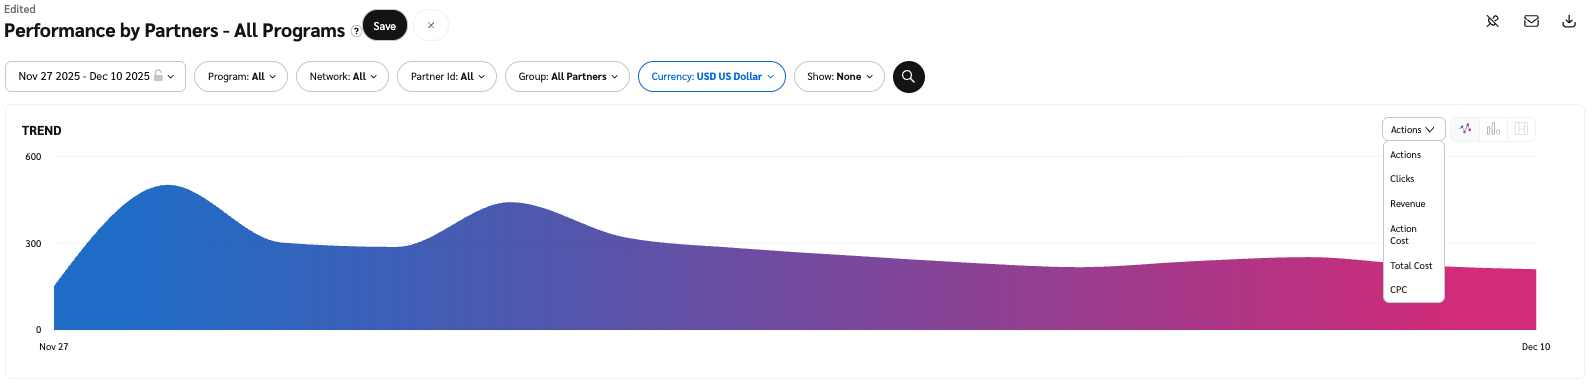
Below the trend graph is the data table. The data table provides different data points displayed in a column view. This view provides a detailed set of comparable numbers over the selected date range.
Refer to the Report data column reference below for more information on the columns found in the data table.
Add or remove columns from the report table using the
![[Column]](https://paligoapp-cdn-eu1.s3.eu-west-1.amazonaws.com/impact/attachments/f01cdffa431a4d75ff09c130b66974d4-63cbd5b88168715b031f0dd433962072.svg) [Columns] icon at the top-right of the report.
[Columns] icon at the top-right of the report.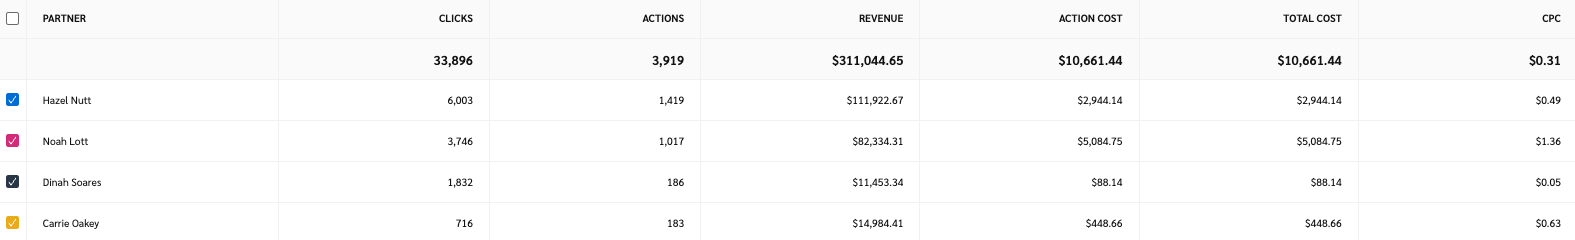
Column
Description
Partner ID
The unique identifier of the partner to which the performance data belongs.
Partner
The name of the partner to which the performance data belongs.
Program ID
The unique identifier of the program to which the performance data belongs.
Program
The name of the program to which the performance data belongs.
Program Type
The type of program to which the performance data relates (i.e. Affiliate, Creator, etc.).
Impressions
The number of audience members that viewed content.
Clicks
The total number of link clicks that took the partners' audience to your landing page.
Actions
The total number of conversions (sales, app installs, etc.) tracked for a particular partner. This number excludes any reversed conversions.
Revenue
This is the total amount of sales/conversions partners have generated from a particular program.
Action Cost
The amount of compensation paid to partners associated with a specific contract for driving the traffic that resulted in conversions.
Other Cost
Additional costs associated with performance bonuses, make-good payments, and placement fees.
Total Cost
The total amount paid out for this contract over the selected period, i.e., the sum of your Action Cost, Click Cost, and Other Cost.
CPC
The Cost Per Click. The total cost is divided by the total number of clicks.
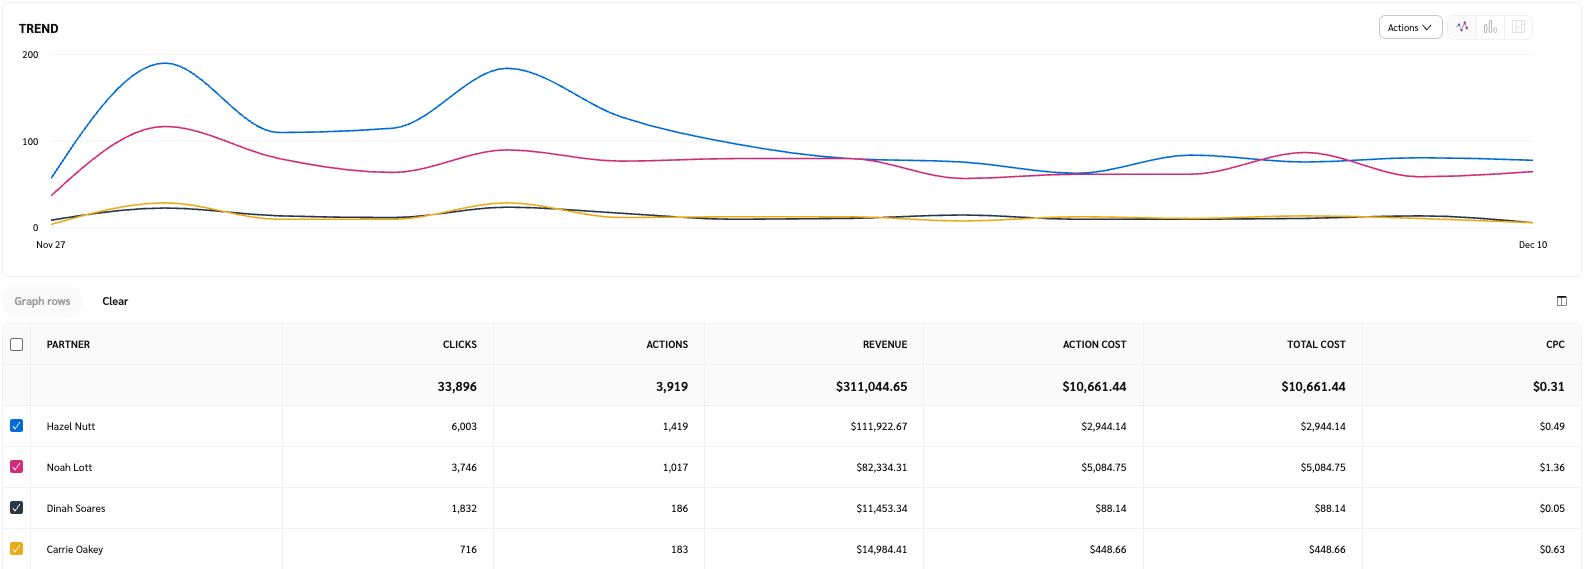
The comparison graph compares the partners of selected rows in the data table based on the metric selected in the trend graph. This graph will show a daily trend of the selected partners over the selected date range.
Select the specific metric from the
![[Drop-down menu]](https://paligoapp-cdn-eu1.s3.eu-west-1.amazonaws.com/impact/attachments/f01cdffa431a4d75ff09c130b66974d4-d6b35853a9aa1f1fe6bd66da29bd09fa.svg) [Drop-down menu] in the trend graph.
[Drop-down menu] in the trend graph.Select the empty checkbox next to the row in the data table for the metrics you want to compare.
Each selected checkbox will be displayed in a specific color that will reflect in the trend graph.
Select Graph rows to compare the selected rows.
Select Clear compare to clear the trend view.